


Prove Your Impact
From an engaged innovation culture to implemented ideas, Ideanote helps you prove your innovation efforts are bearing fruits with inbuilt reports that track your impact from day one.

Celebrate Success
Innovation is a team sport — and you'll want to celebrate and appreciate your successes just as much. Ideanote makes it easy to find and share your innovation success stories with your crowd.

Identify Talent
Innovation-led growth can uncover hidden innovators across your workforce — the further you reach into your organization the more you'll realize the entrepreneurial genius that was hiding in plain sight.
Everything you need for automatic and manual insights on your innovation.
Track Strategy Progress
Tie idea collections to goals. See completed ideas, ROI, and who drives progress.

See Who's Showing up and Who's Not
Track visits, ideas, and time spent. Know what's working with your team. Simple charts. Real answers.
.png)
See What Your Team is Really Thinking About
Spot patterns in your ideas. Topics cluster and wordclouds show you where innovation is heading in real time.

See the Real Value of Your Innovation Work
Track costs, time saved, and revenue generated. Build simple scorecards that show what your innovation programs deliver to the business.

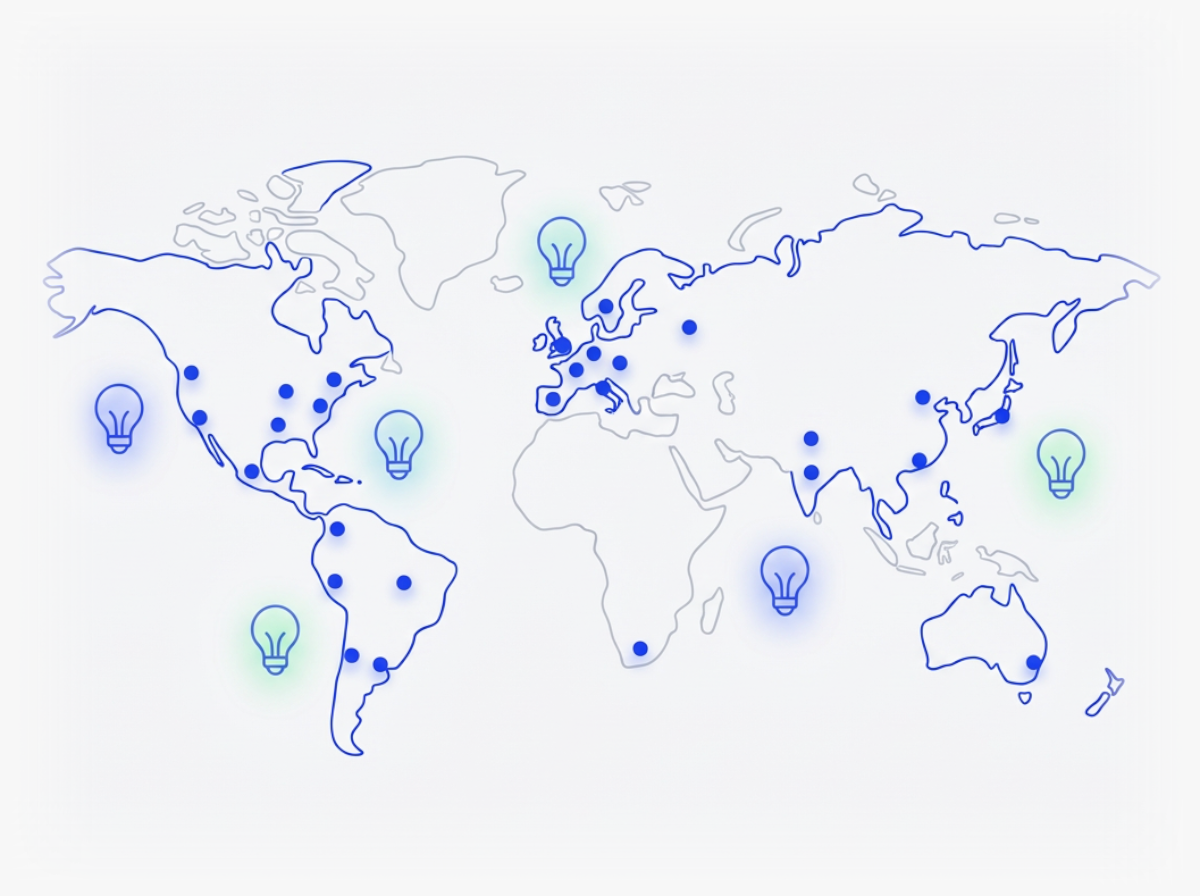
See Where Your Best Ideas Come From
Turn your idea collection into a visual world map. Show your team and stakeholders where innovation happens across locations.
Two-Axis Idea Map
Customize axes, color and size to find high-impact low-effort ideas and watch new submissions appear on the chart.
.png)
Measure Innovation Your Way
Track and celebrate your innovation impact.

Link idea collections to strategic goals and track progress

See idea activity, top contributors, and engagement trends

Visualize and manage idea trends with clustering and plots

Track idea ROI with numeric values and impact reports

View idea submissions on a world map.

X-Y plot: Map ideas by two metrics with colored, sized bubbles

Custom charts with filters by team, time, fields, metrics

Export Ideanote analytics to Excel or share dashboard snapshots

Showcase completed ideas in a shared, customizable trophy room

Set KPI target lines on charts to track goals.

Visual pipeline overview with Kanban and funnel charts

Share live, prefiltered dashboards with secure report links

Shared charts for idea collections, auto-added to templates

Easy analytics and Excel export across Idea Collections
Smart and Easy Idea Management
Try Ideanote for Free. No Credit Card Required.