

Work with ideas wherever you like.
Ideanote lets you export any ideas you collect in a clear an hassle-free format ready for further processing.
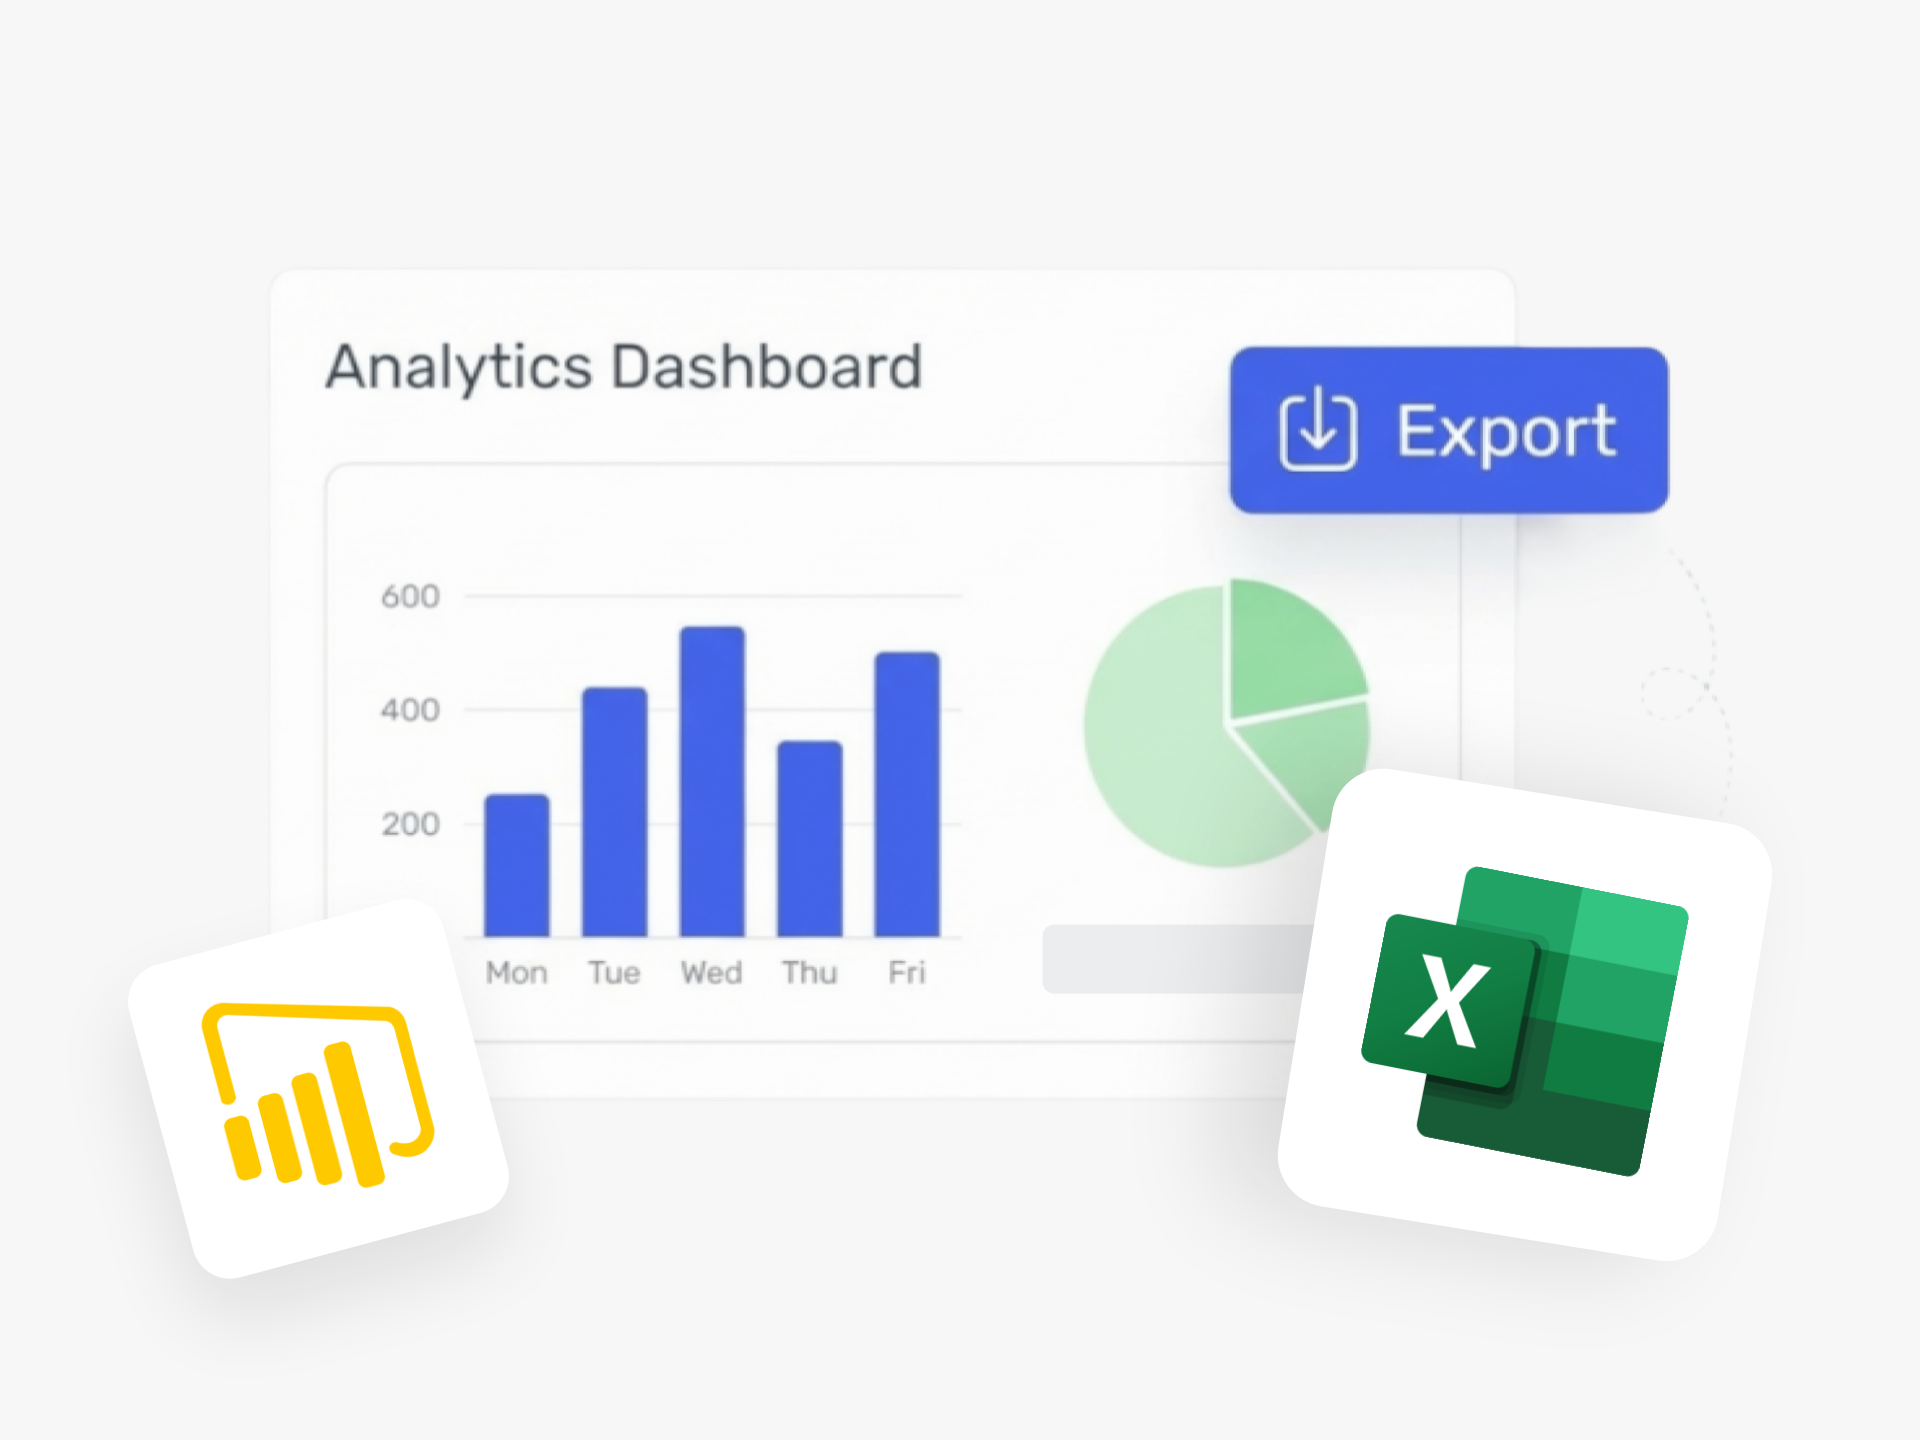
Do You Need to Share Innovation Data With Your Board or Export to Power BI?
Your quarterly board meeting needs a snapshot of innovation activity. Your finance team works in Excel. Your executive dashboard lives in Power BI. Ideanote gives you the data where you need it.
Build custom dashboards with the charts and filters you want, then export the analytics data to Excel with one click. You get a spreadsheet ready for your internal reporting workflow. Take a snapshot at the end of each quarter. Share it with stakeholders who don't log into Ideanote daily. Use it as a source for your BI tools.
The same approach works for idea data. Export all submitted ideas, their status, ratings, and comments into a spreadsheet. Your team gets the raw data behind the charts. You control when to capture the snapshot and who sees it.
This means you don't need to choose between Ideanote analytics and your existing reporting tools. Use the filtering and segmentation inside Ideanote to get the view you need, then export it. Your CFO gets the Excel file she expects. Your innovation dashboard in Power BI pulls fresh data. Your board presentation shows progress since last quarter.
Ideanote fits into how your organization already reports and makes decisions.
How Do I Export Analytics Data From Ideanote?
You build your dashboard with the charts and filters you need, then choose to export the data. You get an Excel file with the analytics data behind your dashboard. This works for any timeframe or segment you want to capture.
You decide when to export. Many teams do this monthly or quarterly to create snapshots for internal reports and presentations.
Can I Export Analytics to Power BI or Other Business Intelligence Tools?
Yes. You export the analytics data as an Excel file from Ideanote. From there, you load that file into Power BI, Tableau, or any other BI tool your organization uses.
This approach lets you combine Ideanote analytics with other data sources in your BI environment. You control the refresh schedule based on when you export.
Can I Share Dashboards With Executives or Specific Stakeholders?
Yes. You share a dashboard link with specific people in your organization. You control who sees which dashboards through role-based access settings.
This lets you create executive-ready views without giving full platform access. Leadership sees the metrics and status updates they need without navigating the full workspace.
Can I See the Raw Data Behind the Charts?
Yes. You click into any chart to drill down to the underlying ideas and data. The Excel export also includes the source data, not only the aggregated numbers.
This helps when someone asks about a specific spike or trend in your reports. You trace back to the individual ideas and responses that drive each metric.
Can I Customize the Analytics Dashboard for Our Specific Reporting Needs?
Yes. You build custom dashboards by adding the charts, filters, and segments relevant to your team or initiative. You create as many dashboards as you need for different purposes, teams, or time periods.
Common setups include separate dashboards for quarterly business reviews, department-specific metrics, or campaign performance tracking. Each dashboard saves your configuration for repeated use or export.
Can I See the Status of All Ideas Across Different Collections in One View?
Yes. You create a consolidated dashboard that pulls ideas from multiple collections. You filter by status, phase, or any other field to see your full innovation pipeline at once.
This consolidated view helps when reporting to leadership or coordinating across teams. You see how many ideas sit in each phase and where attention is needed.
Can I Automate Monthly or Quarterly Reports to Go Out to Stakeholders?
You set up the dashboard once with the metrics your stakeholders need. When it's time to report, you export the current data or share the live dashboard link. The dashboard updates in real time, so shared links always show current numbers.
For recurring reports, many teams add a calendar reminder to export and distribute the Excel file. The export captures a point-in-time snapshot for your records and presentations.
Identify top innovators and easily communicate your innovation success with a platform that makes your impact visible.


Smart and Easy Idea Management
Talk to our Experts or try Ideanote for free. No credit card required.