

Share Metrics and Charts With Stakeholders
Share reports per idea collection with owners and stakeholders. Include key charts and add them to default collection templates.
Who Sees What in Your Idea Collection?
Your executives want to track progress. Collection owners need activity metrics. Stakeholders ask for updates. You spend hours building decks instead of running programs.
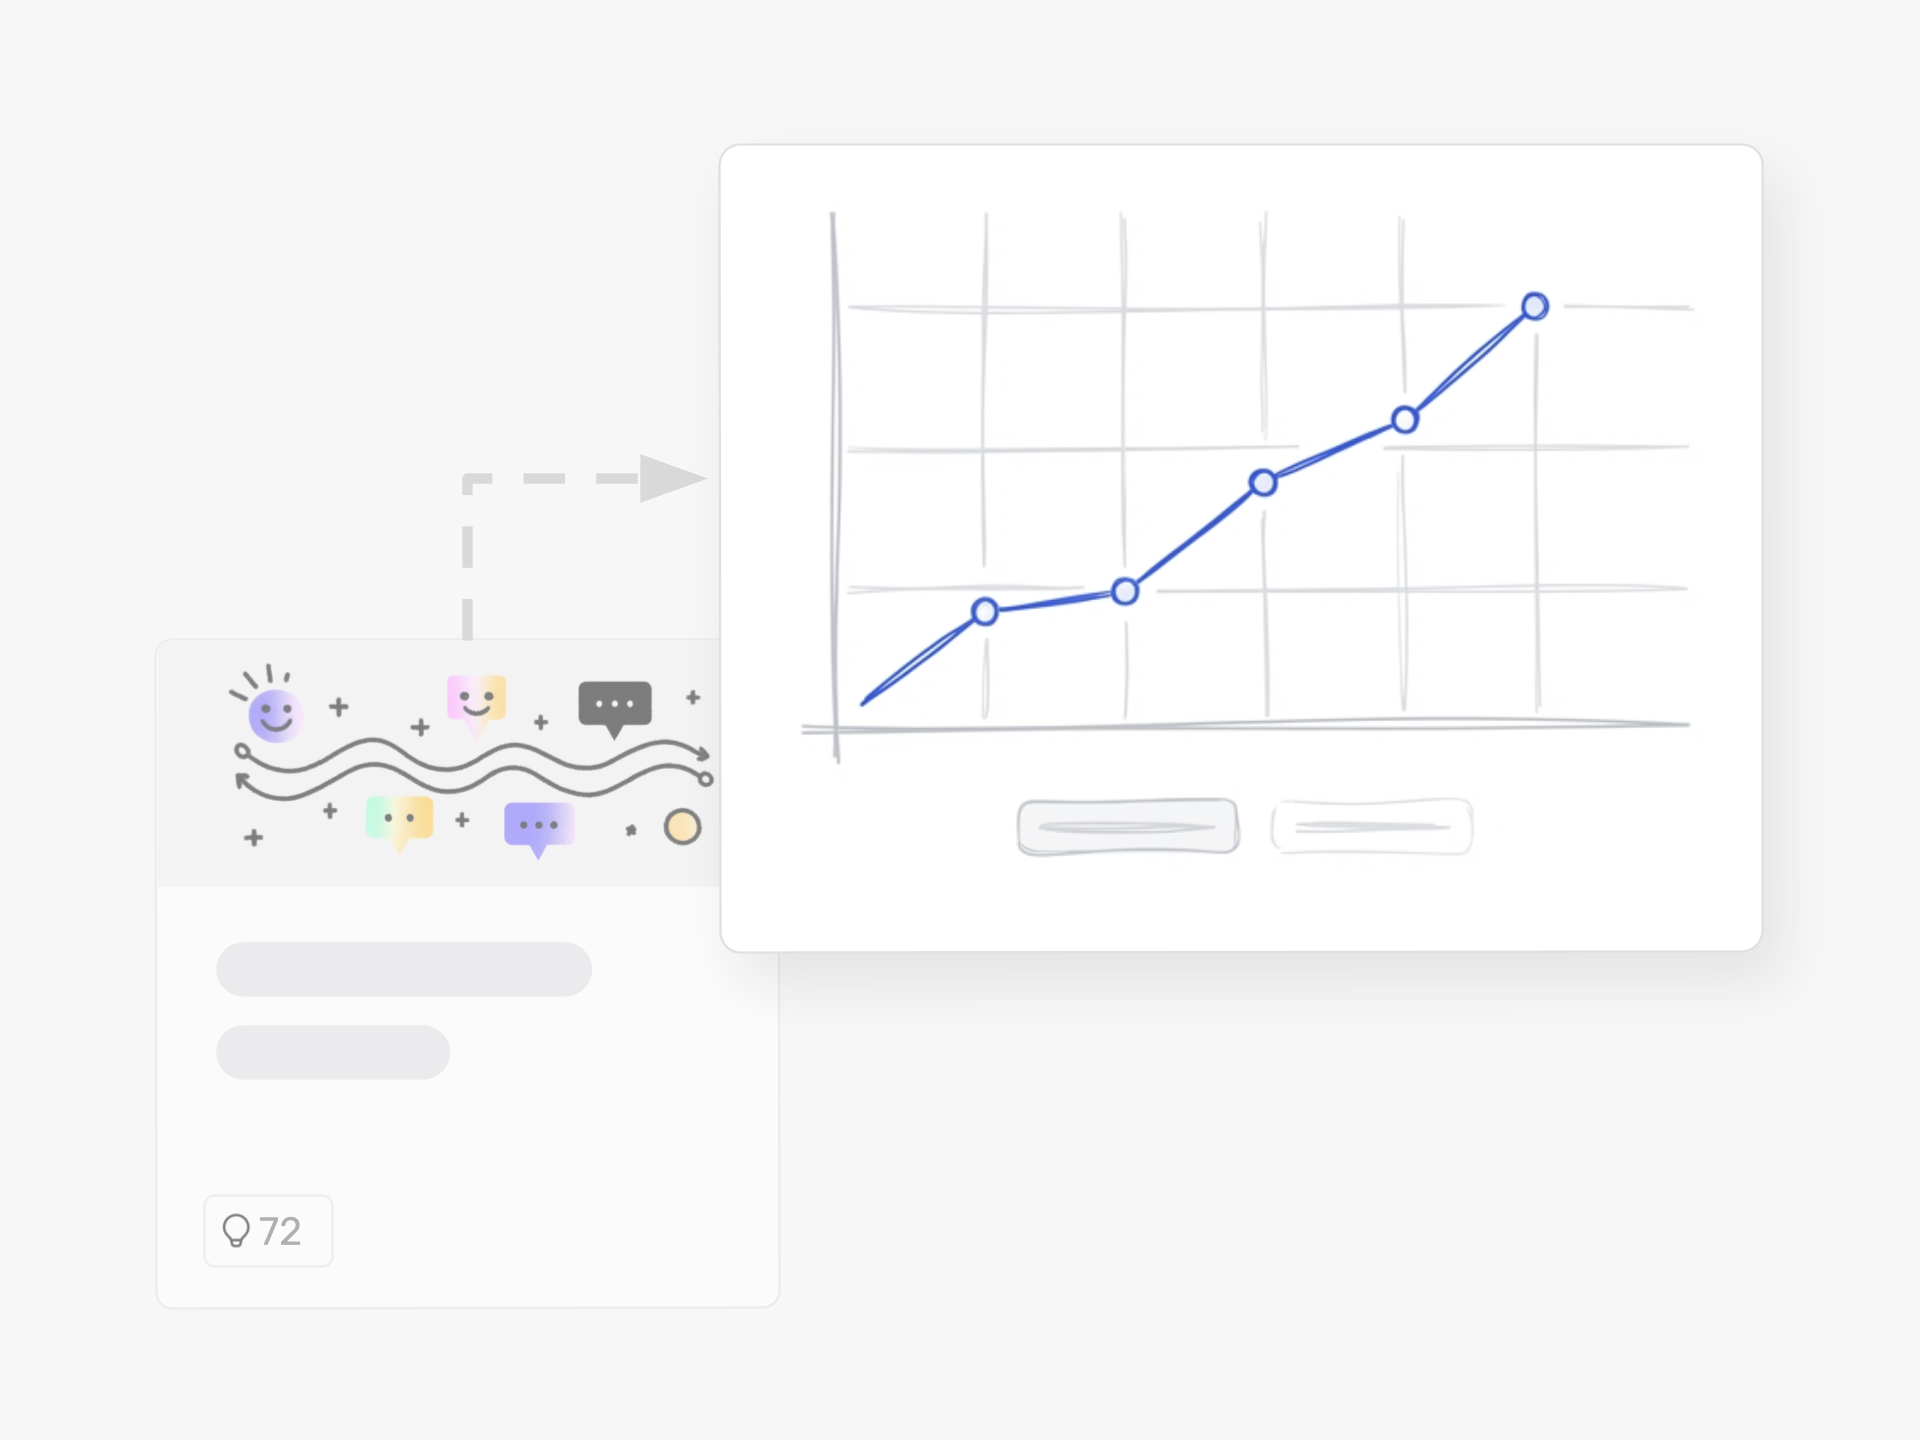
Ideanote's Idea Collection Reports let you share visual charts and campaign metrics directly with the people who need them. Choose which stakeholders see which collection reports. Every chart displays real-time data on submissions, engagement, phase distribution, and idea status.
Set up Once, Reuse Every Time
Add charts to your default templates. When you launch your next employee suggestion campaign or product innovation challenge, the same reporting structure appears automatically. No rebuilding dashboards. No copying configurations. Your teams get the visibility they need from day one.
Built for Stakeholder Visibility
Collection owners see their campaign performance. Department heads track their initiative pipelines. Executives view portfolio status across teams. The reports update as ideas move through your workflow, so your stakeholders always see current metrics.
Stop manually compiling updates for each collection. Start with reports that match how you run innovation.
Who Should See the Idea Collection Reports?
You decide who gets access to each report. Share reports with the collection owner, your executive team, department heads, or any stakeholder who needs visibility into how your idea collection performs.
Role-based permissions let you control who sees which data. This means you can give your CEO a high-level overview while your innovation manager sees detailed campaign metrics.
What Metrics and Charts Are Included in the Reports?
Reports show key metrics about your idea collection through visual charts. You see how many ideas came in, engagement levels, submission trends, and other campaign performance data.
The charts give you a clear view of activity in each collection. You pick which charts matter most for your goals and add them to your reports.
How Do I Share Reports With Stakeholders?
Share reports directly with stakeholders through the platform. Each idea collection has its own report view that you grant access to specific people.
Recipients see the charts and metrics you chose for that collection. They get a clear snapshot of performance without needing to log in and search through the platform.
Can I Reuse the Same Charts Across Multiple Collections?
Yes. Add your preferred charts to a default template. When you launch a new idea collection using that template, the charts appear automatically.
This saves you from setting up the same reports every time. Your reporting stays consistent across all your collections and campaigns.
Can I Export the Data or Charts for Presentations?
You can export data from your collections to use in spreadsheets and presentations. This lets you pull metrics and insights out of the platform.
Export options help you create stakeholder updates, board presentations, or integrate data into your existing reporting tools.
Do Reports Update Automatically or Do I Need to Generate Them Manually?
Reports reflect live data from your idea collection. Stakeholders see current metrics when they view the report.
You do not need to regenerate or refresh reports manually. The charts and metrics stay up to date as new ideas come in and activity happens.
Can I Track Outcomes and ROI From Implemented Ideas?
You can document results and track what happens after you implement ideas. Add outcome data to show the impact of your innovation efforts.
This helps you report on real business results, not just activity. Track cost savings, revenue generated, or other KPIs that matter to your leadership.
Identify top innovators and easily communicate your innovation success with a platform that makes your impact visible.


Smart and Easy Idea Management
Talk to our Experts or try Ideanote for free. No credit card required.