

Workspace Reports: Track Idea Pipeline, Contributors, and ROI
See idea counts, stages, implemented projects, top contributors, and ROI across teams. Export workspace reports to Excel for easy sharing.
How Do You Report on Idea Pipeline, Impact, and Engagement Across Your Organization?
Workspace Reports give you a complete view of your innovation activity across all collections, teams, and departments. You see the number of ideas collected, how many sit in each phase or status, which projects moved to implementation, and who contributes most.
This is the consolidated dashboard your leadership team asks for. You get pipeline visibility in one place, not scattered across separate campaigns or spreadsheets.
Track What Matters: Ideas, Stages, and Impact
Filter and view ideas by workflow stage, department, or collection. See your idea inventory at a glance. Track how many ideas entered evaluation, reached decision, or shipped to production.
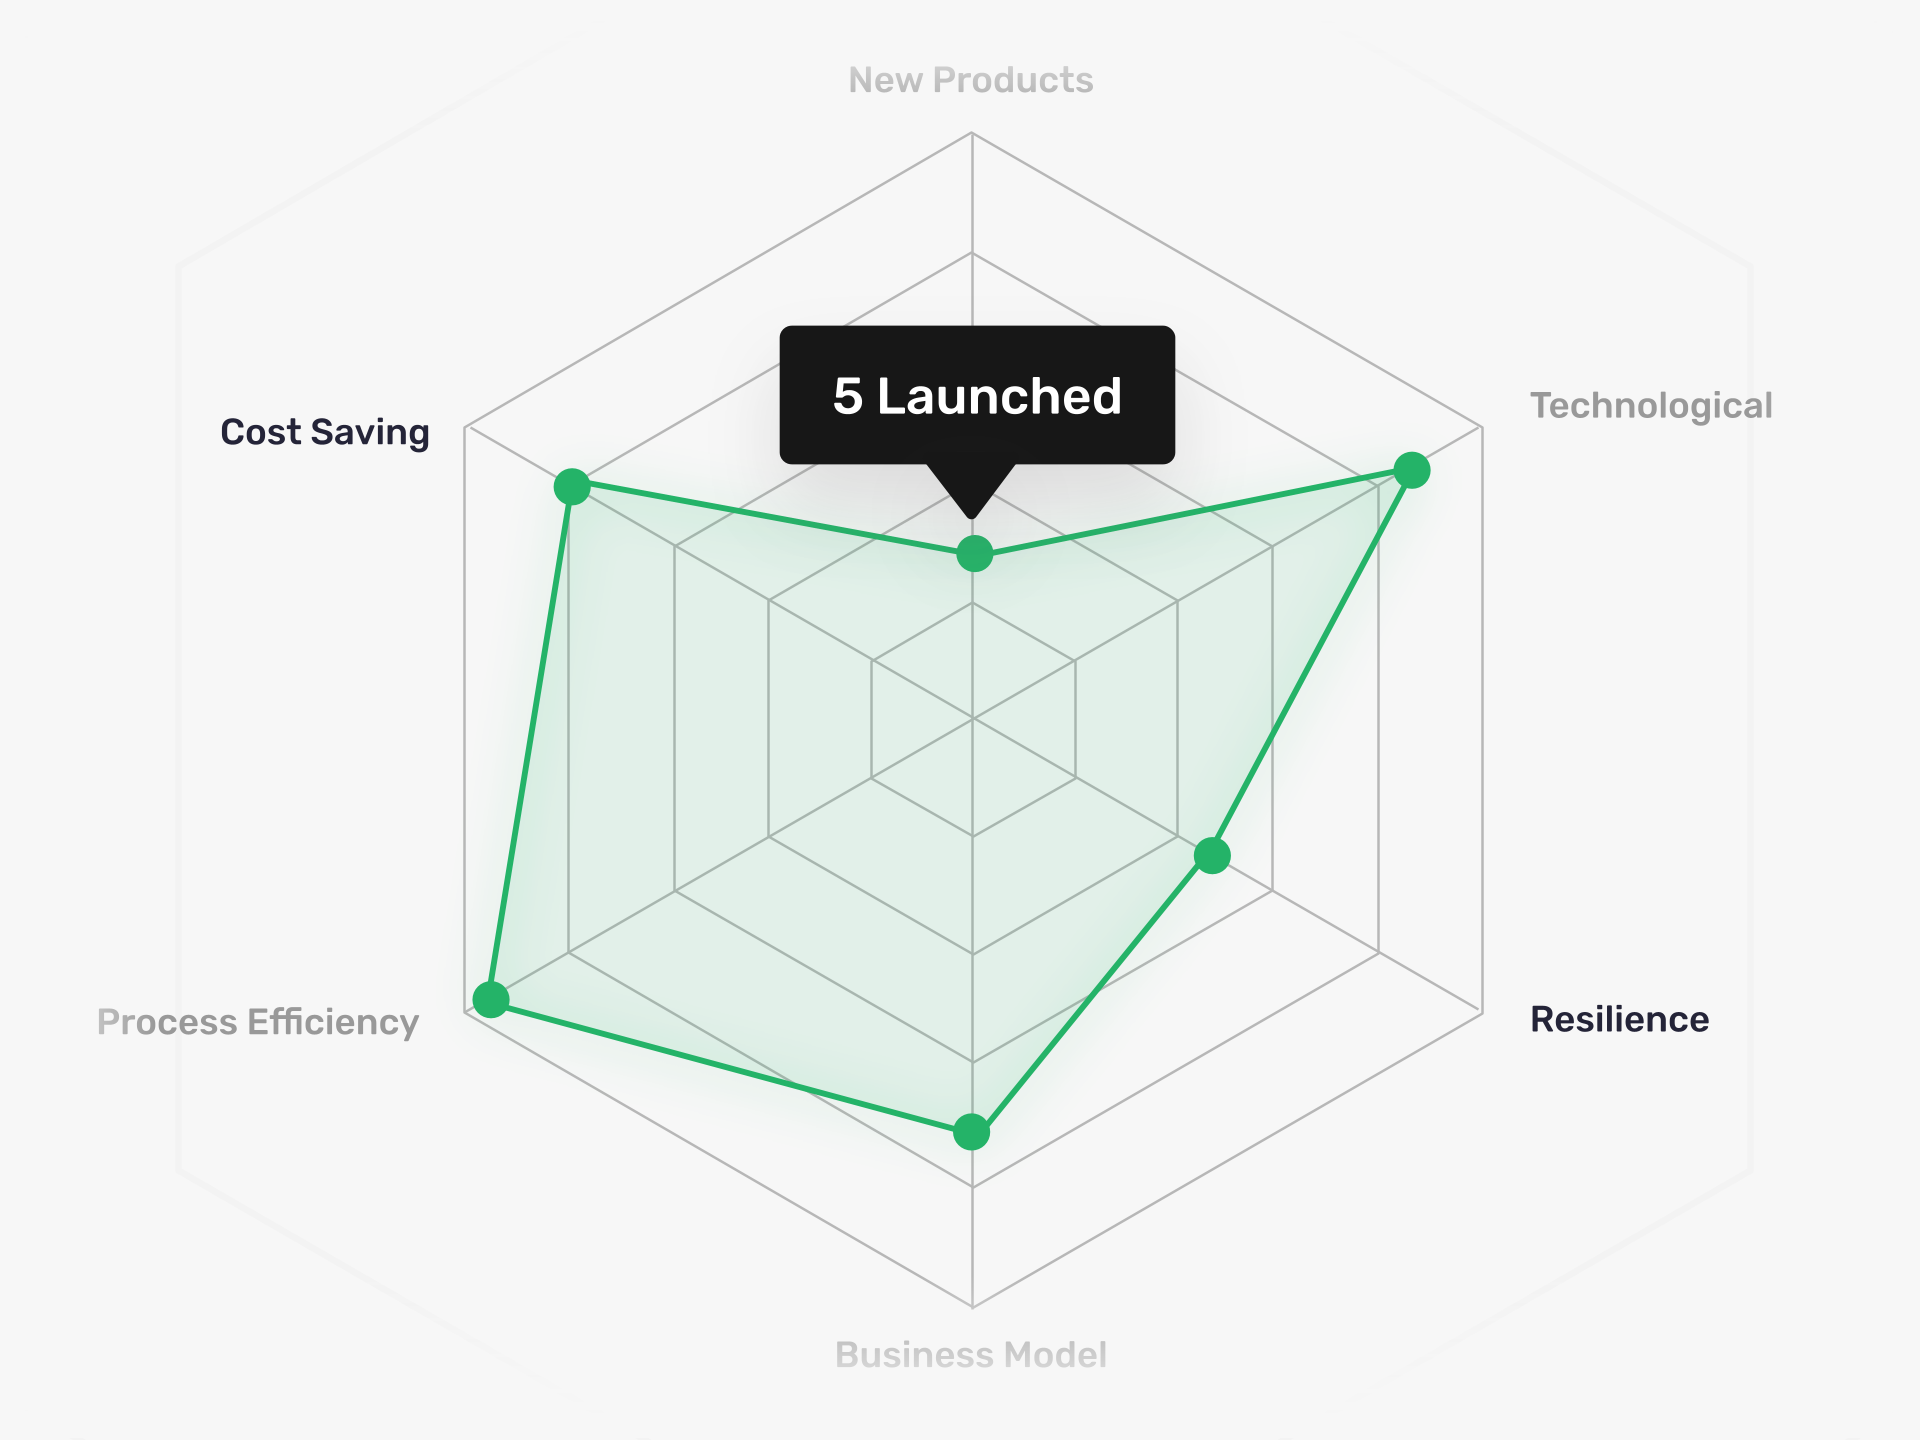
You also track ROI and impact. Set up charts that sum or average numerical fields like cost savings, revenue impact, or efficiency gains. If your ideas include financial estimates or KPI data, Workspace Reports roll those numbers into organization-level metrics.
Export to Excel and Share With Stakeholders
Download any workspace report as an Excel file. Your executives, finance team, or board want reports in spreadsheet format. You export the data and share it without manual copying or reformatting.
Workspace Reports turn your idea pipeline into clear, shareable insights for decision-making and strategic planning.
What Reporting Does Ideanote Offer at the Workspace Level?
Workspace Reports give you a full view of your idea pipeline across all collections, phases, and teams. You see total ideas collected, implemented ideas, top contributors, status breakdowns, and activity by department.
You build custom reports with the data points you need. For example, you choose to track ideas by phase, by team, or by implementation status. You then export these reports to Excel for sharing with executives or other stakeholders.
Can I Track ROI and Impact From Implemented Ideas?
Yes. You set up reports that calculate ROI by averaging or summing numerical fields across your ideas. This works when you add custom fields to track data like cost savings, revenue impact, or time saved.
You create a chart that pulls from those fields to show total value or average impact. Then you export the results to Excel or share the report dashboard with leadership.
Can I See Ideas Across All Collections in One View?
Yes. Workspace Reports pull data from across all your idea collections. You filter and view ideas by phase, status, department, or other criteria without switching between individual collections.
This gives you the pipeline overview you need to answer questions like how many ideas are in evaluation across the organization, or which teams contribute the most.
Can I Export Workspace Reports to Excel or Power BI?
You export any workspace report to Excel directly from the platform. This makes it easy to share reports with stakeholders who prefer spreadsheets or want to do further analysis offline.
For Power BI and other BI tools, you export the Excel file and import the data into your preferred analytics platform. This allows you to integrate idea data into broader business intelligence dashboards.
Who Has Access to Workspace Reports?
Workspace Reports are available to workspace admins and other users with the right permissions. You control who sees which reports by setting access levels in your workspace settings.
This means you show high-level dashboards to executives while keeping detailed operational reports available only to innovation managers or program leads.
Can I Filter Reports by Phase, Status, or Team?
Yes. You build reports with filters for phase, status, department, team, and other attributes. For example, you create a view showing only ideas in the evaluation phase, or all ideas submitted by a specific department.
These filters let you drill into the data you need and answer specific questions about your innovation pipeline without sifting through everything manually.
Can I Automate Reports or Schedule Regular Exports?
Workspace Reports are available on demand inside the platform. You export them to Excel whenever you need to share an update.
For automated distribution, you export the report and set up your own email schedule or integrate the Excel file into your existing reporting workflows.
Identify top innovators and easily communicate your innovation success with a platform that makes your impact visible.


Smart and Easy Idea Management
Talk to our Experts or try Ideanote for free. No credit card required.