

Thank you! Your submission has been received!
Oops! Something went wrong while submitting the form.


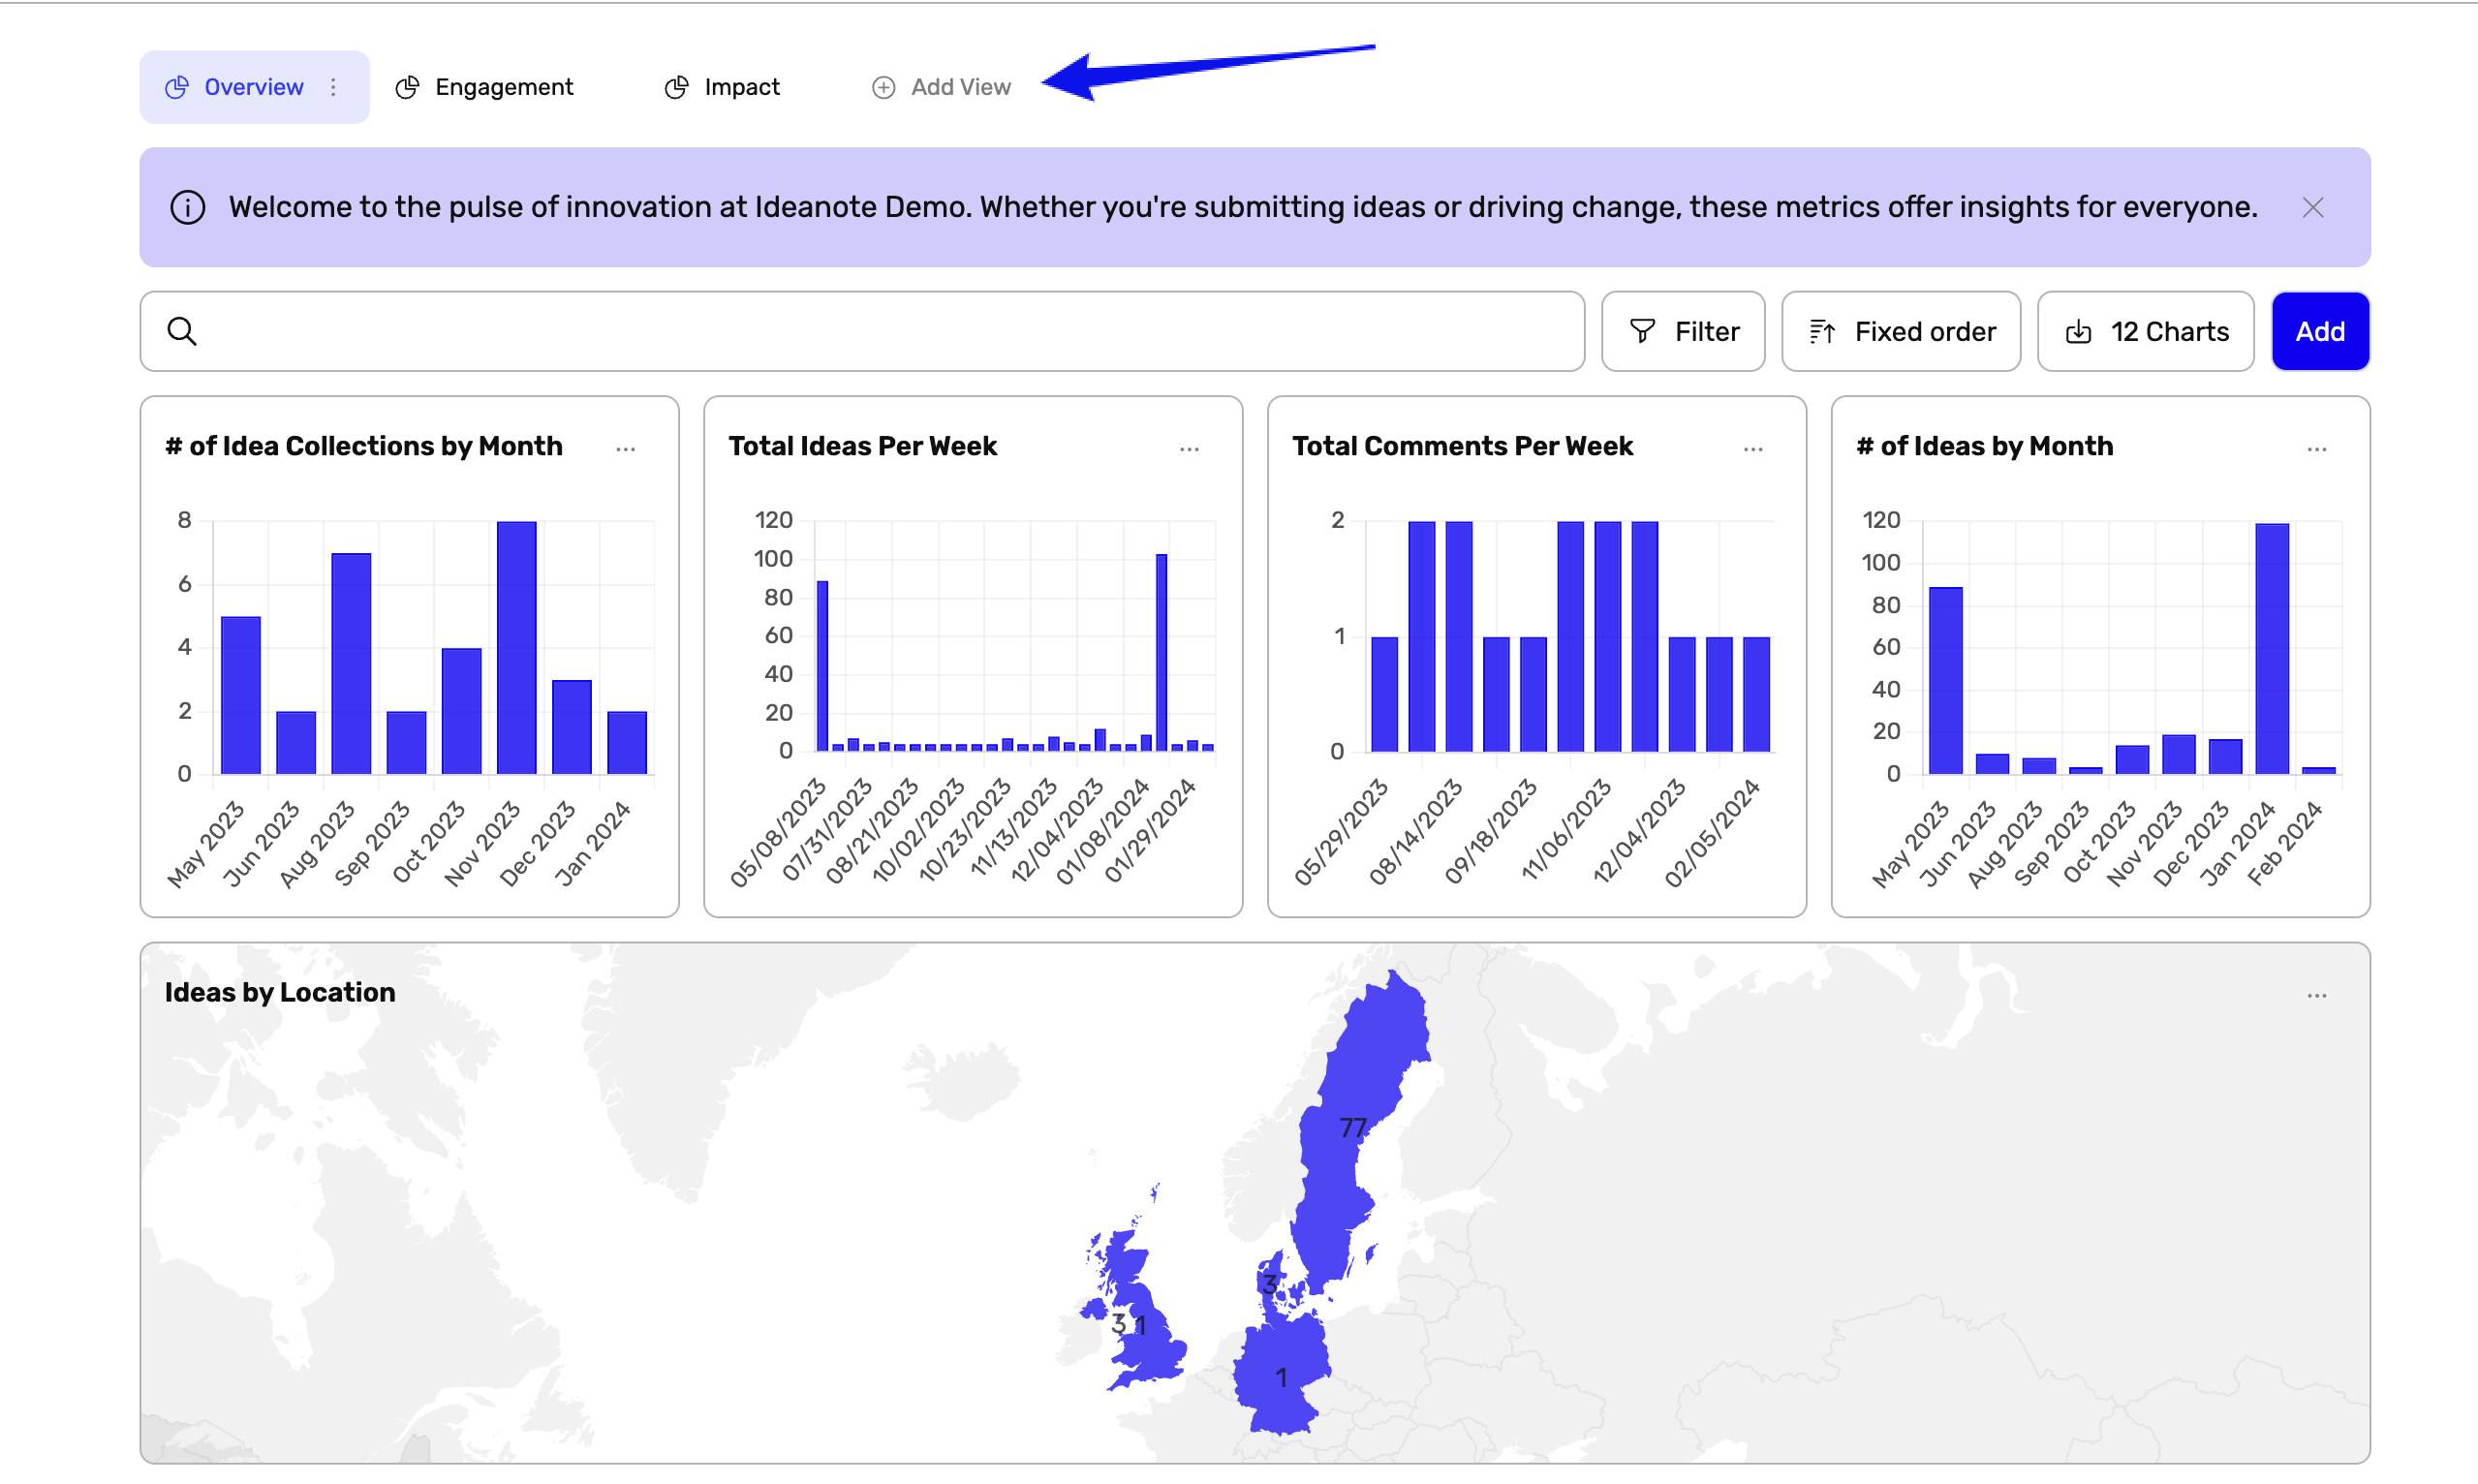
Intro to Analytics
Gain a comprehensive understanding of activities within your Ideanote Workspace and within your Idea Collections, all at your fingertips.
Create an overview of activities spanning across all Idea Collections, achievements that matter to your Team and Organization.
With a permission-based access, align your reporting needs in few clicks with Analytics. Create, combine and organize the data into a visual story for your Audience.
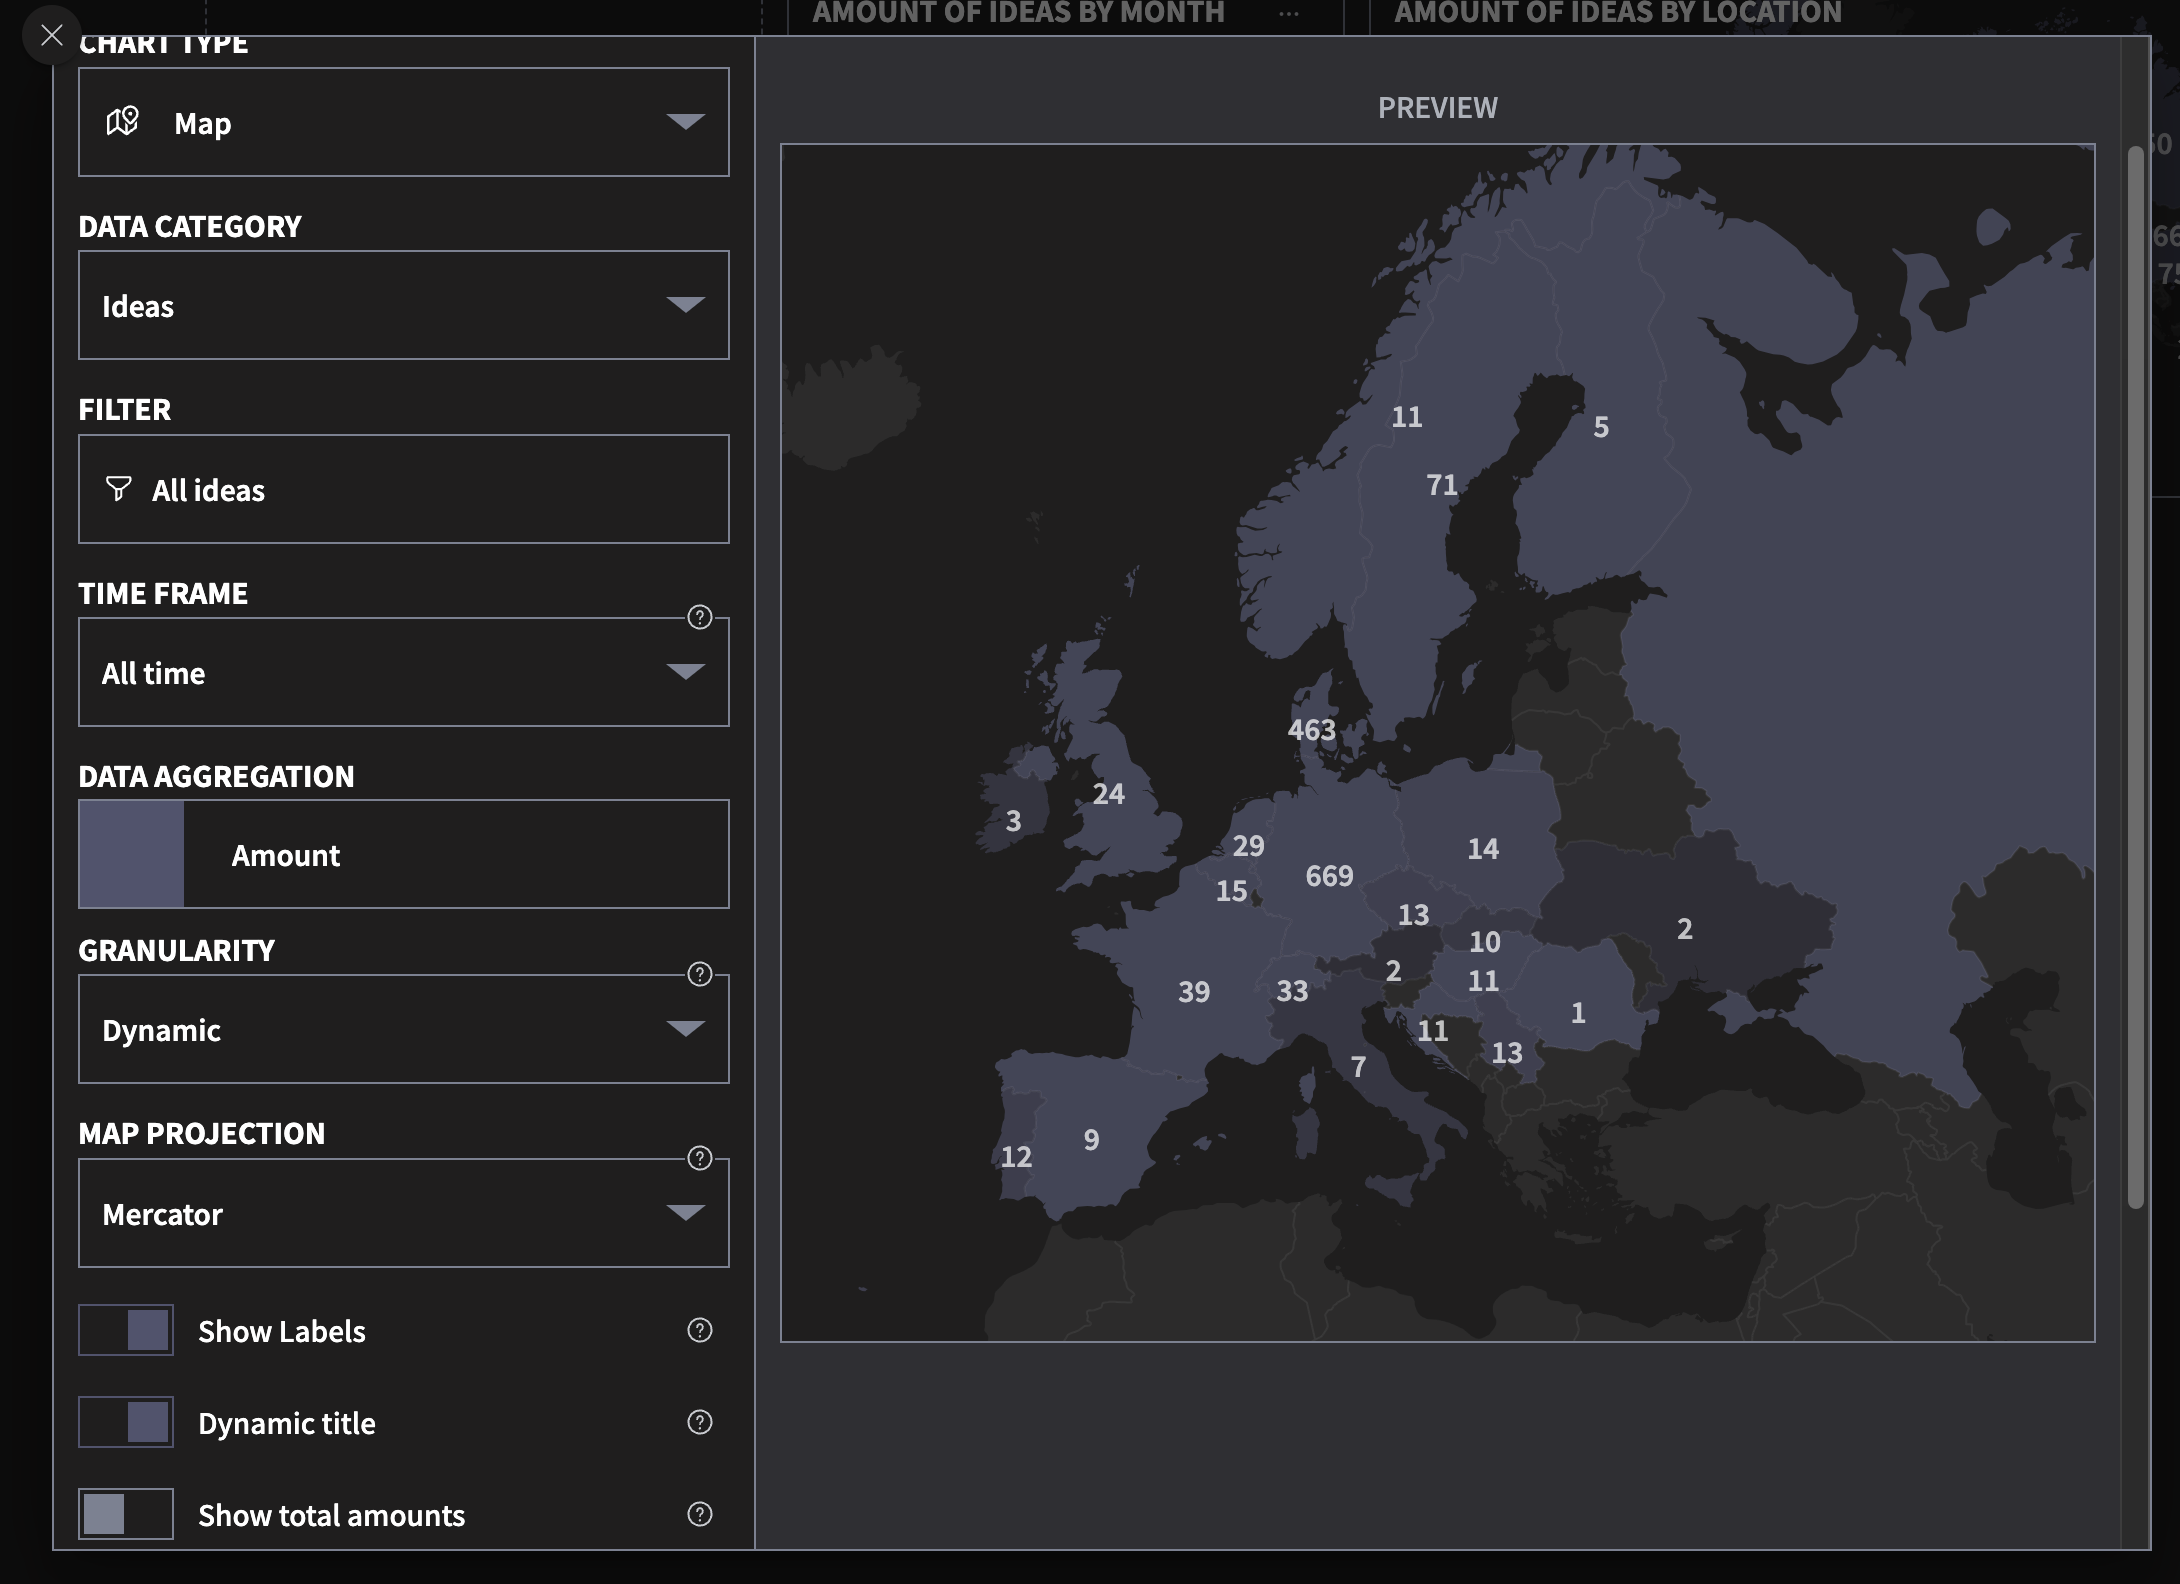
Create a New Chart
Create a View
Set Permissions

Inspirations
Below are different chart types for inspirations. The data included in these charts is fictitious data.


Next:
Oops! Something went wrong while submitting the form.