

Celebrate your global innovation
Ideanote comes with an inbuilt shareable idea map that shows where people have submitted ideas.
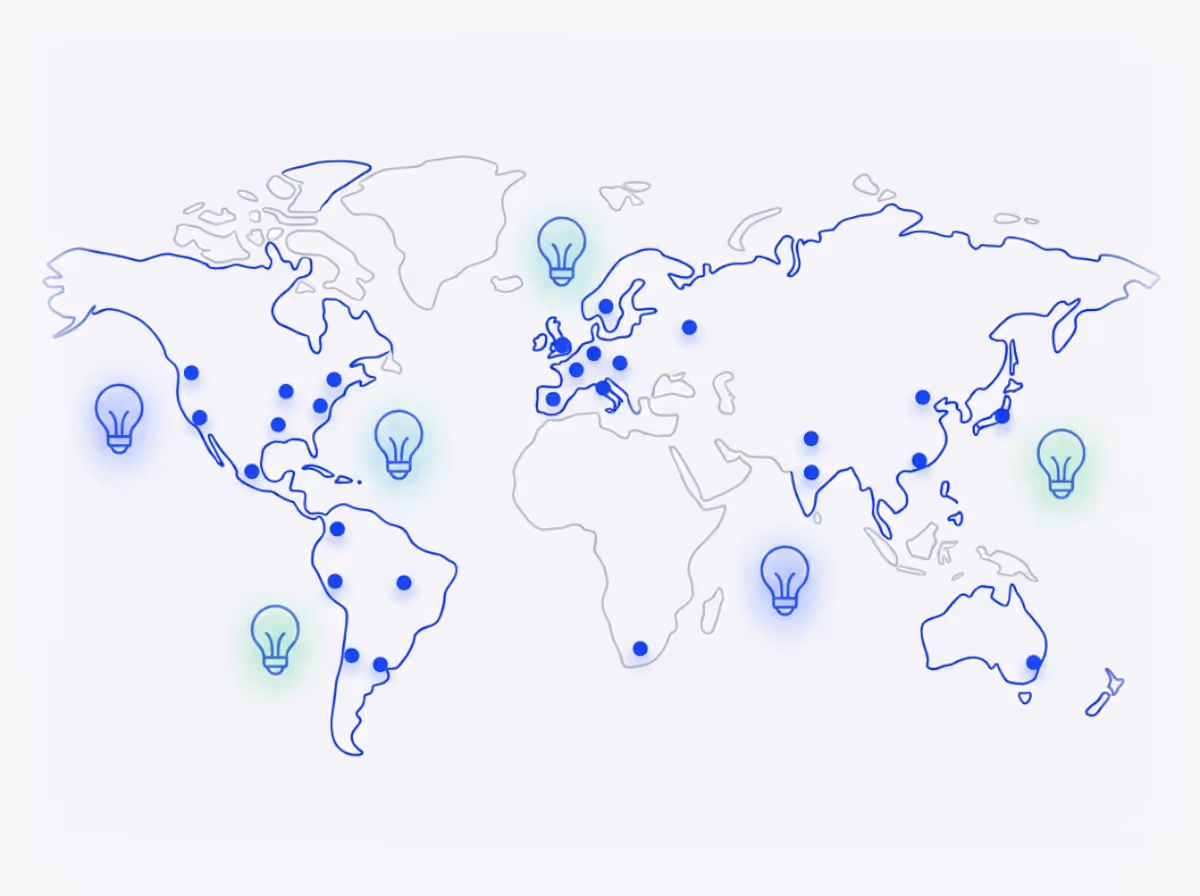
How Do You Track and Compare Innovation Across Teams and Regions?
When you run innovation programs across multiple locations, you need to see where participation happens. Ideanote gives you a visual map of where your ideas come from, based on geo-IP data. You get a clear view of which offices, plants, or regions submit ideas and how engagement compares between them.
The map shows approximate locations for each submission. You control the zoom level and which regions to display. If you have teams in New York and Sydney, you see both on one map. If you want to focus on European offices only, you filter to show those.
What You Get
This view works for internal teams and external feedback. When customers or partners submit feature requests, you see where that input originates. You track participation patterns across time zones and departments. You identify which locations engage most with your innovation programs.
The map is shareable. You send it to leadership, post it on internal channels, or include it in reports. Showing global participation makes innovation visible and encourages teams to contribute. When one region sees another region active on the map, engagement grows.
Ideanote helps you move from scattered feedback to coordinated action across your organization, wherever your people work.
How does the world map track where ideas come from?
The world map uses geo-IP addresses to identify where each idea was submitted. When someone submits an idea, Ideanote logs the approximate location based on their IP address and plots it on the map.
The location is approximate rather than exact, which protects user privacy while giving you a clear picture of your geographic reach. This works for both internal teams and external submissions from customers or partners.
How do I compare participation across different offices or regions?
You generate a map that displays all the locations where ideas have been submitted. You see concentration patterns across your offices, making it easy to compare engagement between regions like your US headquarters and your European plants.
This visual comparison helps you spot which locations are more engaged and where you might need to encourage more participation. Many organizations use this to create friendly competition between sites.
Does the map work for external innovation and customer feedback?
Yes, the world map tracks external submissions the same way it tracks internal ones. When customers or partners submit feature requests or improvement ideas, their location appears on the map based on their geo-IP.
This gives you a geographic view of where your external feedback originates, helping you understand which markets are most engaged with your products or services.
How do I share the world map with my team or leadership?
The world map is shareable, so you export or display it to stakeholders. Many teams share it in newsletters, presentations, or on internal dashboards to show the global reach of their innovation program.
Sharing the map tends to increase engagement because people see their location represented and feel part of a larger effort. The visual format makes your innovation impact immediately clear to executives and participants alike.
Does the map support multiple simultaneous programs across locations?
Yes, you run innovation programs across different office locations and the map will reflect submissions from all active programs. Each program collects ideas from participants wherever they are located.
This makes the world map particularly useful for global initiatives where you want to see cross-regional participation in real time, or for comparing engagement between different local campaigns.
How accurate is the location data on the map?
The map shows approximate locations based on geo-IP data, not exact addresses. You see the general area or city where an idea was submitted, which is enough to understand regional patterns and compare office locations.
This level of precision balances useful geographic insight with user privacy. You get the visibility you need for engagement tracking without collecting or storing precise personal location data.

Gestion d'idées intelligente et facile
Contactez nos Experts ou essayez Ideanote gratuitement. Aucune carte bancaire requise.