

Turn big data into insights.
Instantly discover trends and topics with Ideanote's inbuilt wordcloud and natural language processing AI for innovation.
How Do You Find Patterns in Hundreds or Thousands of Ideas?
When your teams submit ideas across different departments and languages, you need a way to see what matters. Ideanote automatically groups ideas into topics and trends using word cloud charts with stem word analysis and cluster graphs.
The cluster graph combines knowledge mapping with automatic topic grouping. Submit thousands of ideas and watch them organize into clear themes. You control how these groups are managed. Move ideas between clusters, create subtopics, or merge similar concepts to reduce duplication.
For strategic planning, use XY plot charts to map trends by size, relevance, and likelihood. Position each trend on a risk versus opportunity matrix. This helps you decide where to invest time and resources.
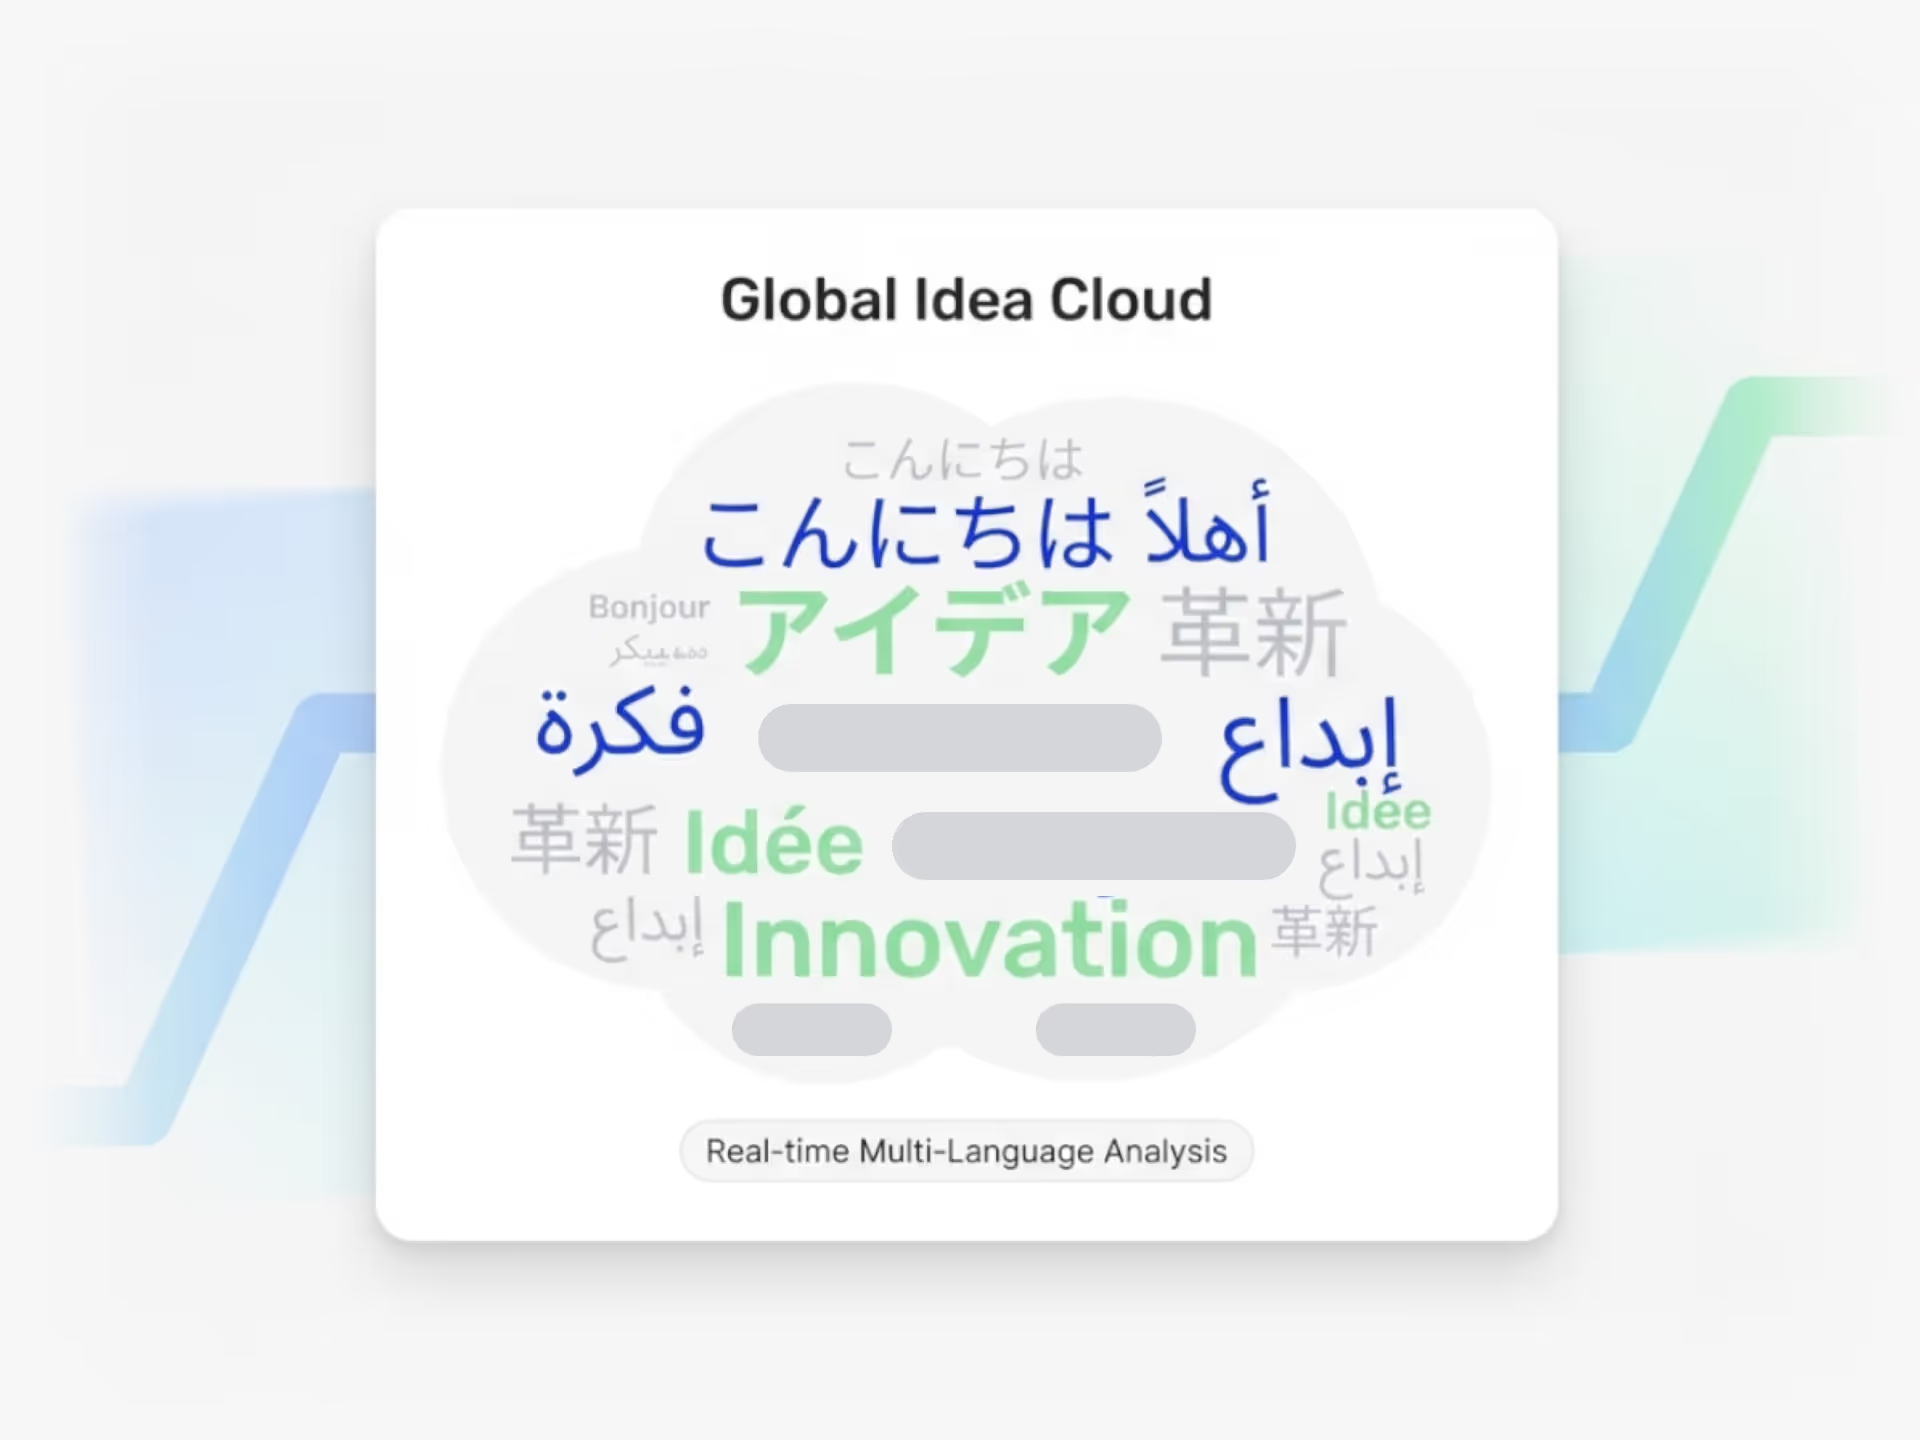
Works Across Languages and Databases
The AI analyzes idea content in multiple languages, connecting related concepts even when teams submit in different languages. You can also integrate external trend databases to pull in signals from outside your organization.
Set up a dedicated trend management collection with custom forms, or analyze trends within specific idea collections. Filter by tags and themes to explore what emerges from your data.
Ideanote becomes your single source of truth for innovation intelligence. You get the structure to make sense of large idea volumes and the flexibility to organize insights your way.
How does trend analytics work in Ideanote?
Ideanote offers two main ways to surface trends from your ideas. The word cloud chart uses stem word analysis to show you which topics appear most frequently. The cluster chart automatically groups related ideas into topics using natural language processing.
You control how these trends are organized. Move ideas between clusters, create subtopics within trends, or adjust groupings manually. This works across thousands of ideas at once, whether you are analyzing a single collection or your entire workspace.
How does Ideanote handle duplicate or similar ideas?
The cluster chart groups similar ideas together based on their content. When ideas share common themes or topics, they appear in the same cluster. This lets you see where multiple people have submitted related suggestions.
You then decide how to manage these grouped ideas. Merge them, link them together, or keep them separate if the details differ. The clustering happens automatically, but you stay in control of what to do with the results.
Can I see which trends are most important or urgent?
Yes. Use XY plot charts to map your trends across two dimensions you define. For example, plot trends by size versus relevance, or risk versus opportunity. This visualization helps you identify which trends need attention now and which to monitor for later.
You define the scoring criteria based on what matters to your organization. Each trend appears as a point on the chart, making it easy to spot high-priority areas at a glance.
Does trend analytics work across different languages?
Yes. The clustering and trend analysis work across multiple languages in your idea collection. Ideas submitted in different languages will still be grouped together if they share similar topics or themes.
This is particularly useful for global organizations where teams contribute ideas in their local language. You get a unified view of trends across your entire organization, regardless of the languages used.
Can I filter trends by category or theme?
Yes. Use tags and custom fields to categorize ideas, then filter your trend views based on these categories. This lets you focus on trends within specific departments, business areas, or strategic themes.
You can apply these filters to both the word cloud and cluster charts. This narrows your analysis to exactly the subset of ideas you want to examine.
Can I use Ideanote specifically for trend management?
Yes. Create a dedicated collection for trend management with a custom form tailored to capturing trend data. Define fields for trend relevance, likelihood, impact, or any other dimensions you track.
You can also integrate external trend databases or signal sources into Ideanote. This turns Ideanote into your central platform for tracking, analyzing, and acting on trends alongside your internal ideas.
Can I link ideas across different trend clusters?
Yes. Manually link related ideas even if they appear in different clusters or trend groups. This is useful when ideas connect to multiple themes or when you want to show relationships between different topic areas.
These links remain visible across your trend views, helping you and your team understand how different innovation themes relate to each other.

Gestion d'idées intelligente et facile
Contactez nos Experts ou essayez Ideanote gratuitement. Aucune carte bancaire requise.